
This article gives a high-level overview of the MotorXP-AFM Design Studio 2.0 user interface: the title bar, the menu bar, the toolbar, the 3D scene and the panels that make up the workspace. It is intended as a starting point — a map of where things are — before diving into the individual design and analysis workflows described in the other articles.
The Welcome screen #
When the application starts, it opens on the Welcome tab. This screen groups together everything needed to begin working:
- Get started — quick actions for creating a new motor (File > Create new motor, Ctrl+N), opening an existing project (File > Open, Ctrl+O), or simply dragging and dropping .mxa / .mxap files onto the window.
- Manuals — direct access to the User Manual (F1) and to the offline and online Scripting API manuals.
- Examples — a set of ready-made projects (such as afm_PCB_9s12p, afm_sr12, EMRAX-228) that can be opened and studied.
- Recent files — the list of recently opened projects, with a search field for quickly locating a file.
click on image to enlarge
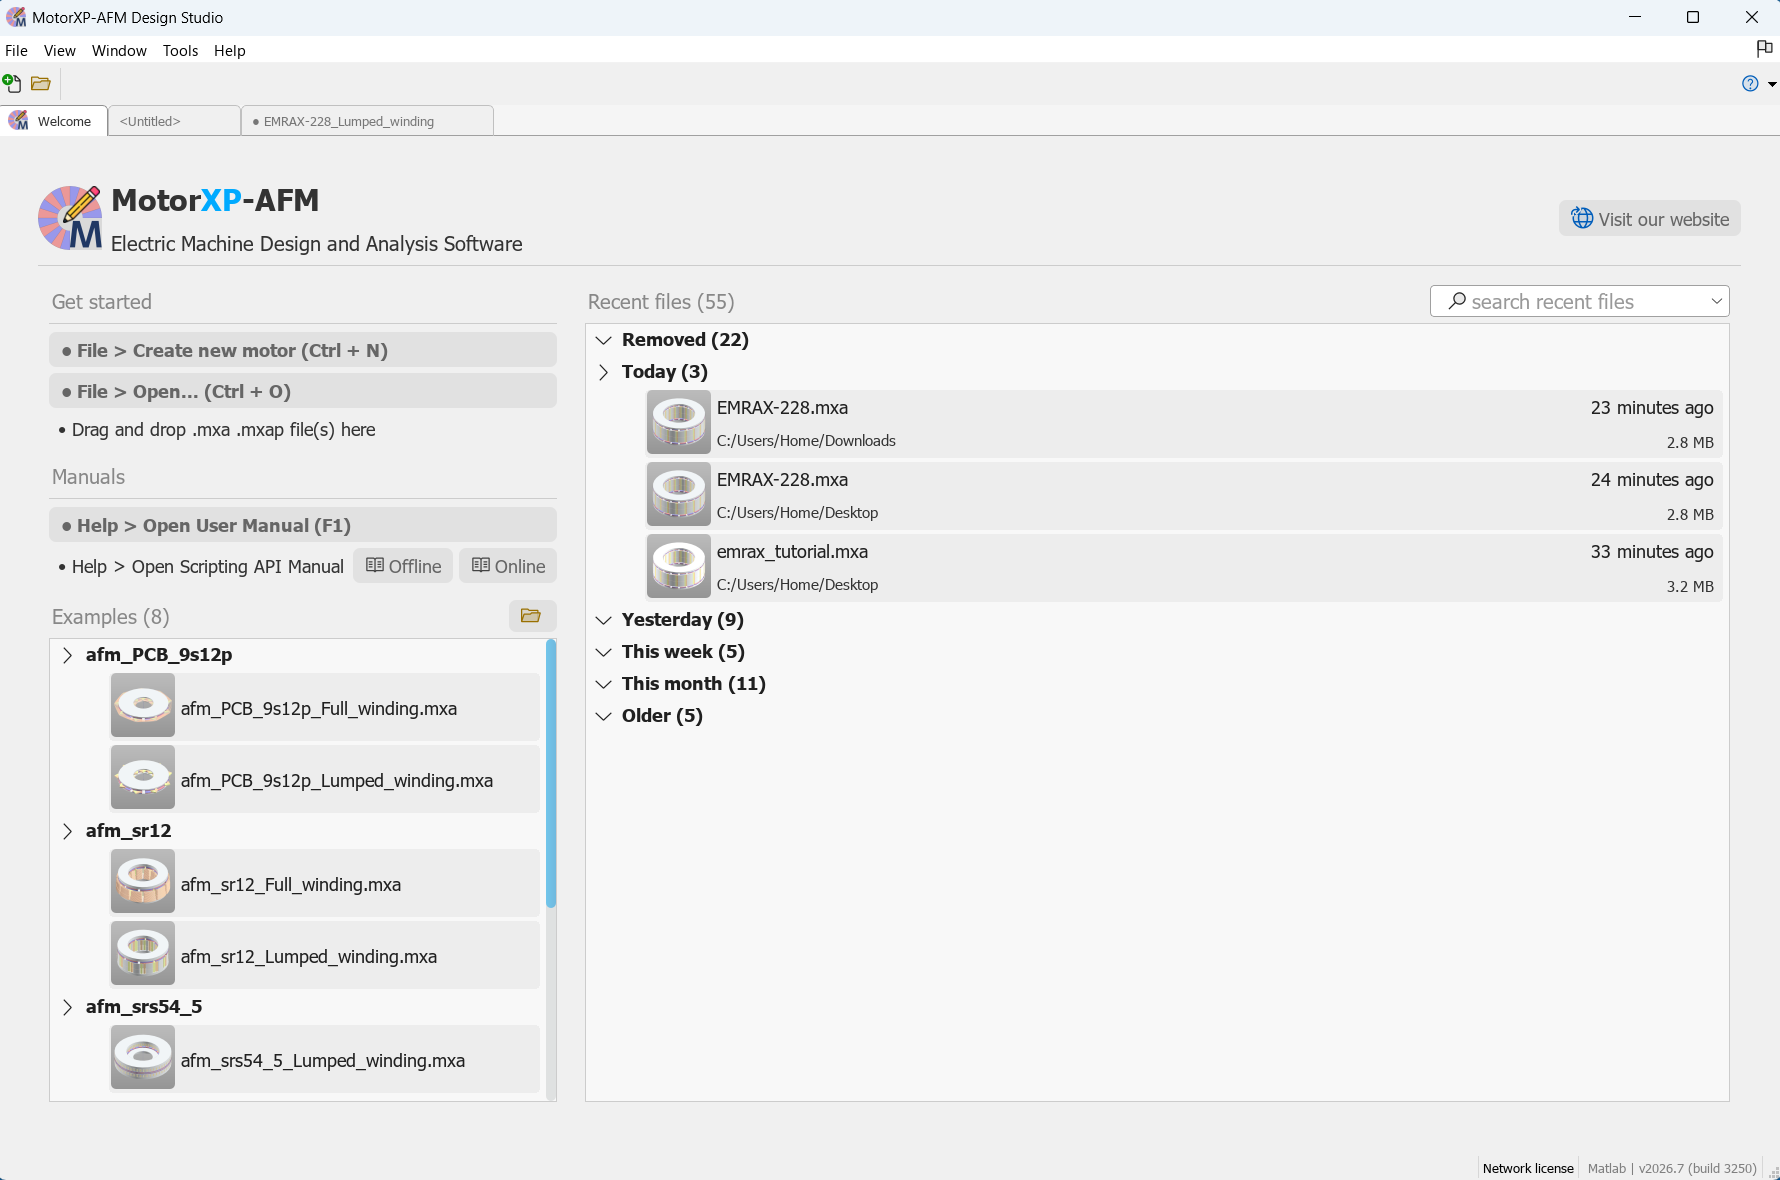
Figure 1. The Welcome screen.
Title bar #
The title bar shows the application name, MotorXP-AFM Design Studio, together with the name of the currently active project. An unsaved project is shown as <Untitled>, and a project with unsaved changes is marked with a leading dot (for example, • EMRAX-228_Lumped_winding). The standard window controls — minimize, maximize and close — are located on the right.
Menu bar #
The menu bar provides access to all the application’s commands. Its contents depend on the context: on the Welcome tab only a reduced set of menus is shown, while an open project adds the Edit menu and the project-related commands.
| Menu | Purpose | Key items |
|---|---|---|
| File | Project and file operations | Create new motor, Open, Recent files, Save, Save as, Export, Settings, Restart, Exit |
| Edit | Editing and copying part properties, running the analysis | Undo, Redo, Stator / Rotor / Windings / Mesh (copy & paste properties), Motor rated data, Run analysis |
| View | Scene navigation and access to application folders | Zoom in / out / fit, Show console (F12), Open app / scripts / user data / logs folder, Developer mode |
| Window | Managing open project tabs | Close, Close all, list of open projects |
| Tools | Maintenance and licensing | Check for updates, Maintenance tool, License Manager, License Server |
| Help | Documentation, support and product information | About, Report a problem, MotorXP website, Release notes, Open User Manual (F1), Scripting API manuals, MotorXP Guide Center |
Note. Problems with the application can be reported directly from Help > Report a Problem. Licensing is configured from Tools > License Manager and Tools > License Server.
Toolbar #
Below the menu bar, the toolbar collects the most frequently used commands as buttons: creating, opening and saving projects; Undo / Redo; scene navigation (Zoom in, Zoom out, Zoom fit); import of geometry from a STEP file; and the green Run analysis button that launches the calculation. A help button on the right opens the documentation.
Workspace and project tabs #
Each open project occupies its own tab next to the Welcome tab, so several motors can be kept open at the same time and switched between with a single click. The workspace of an open project is divided into three main areas: the workflow panel on the left, the 3D scene in the centre, and the context panels on the right.
click on image to enlarge
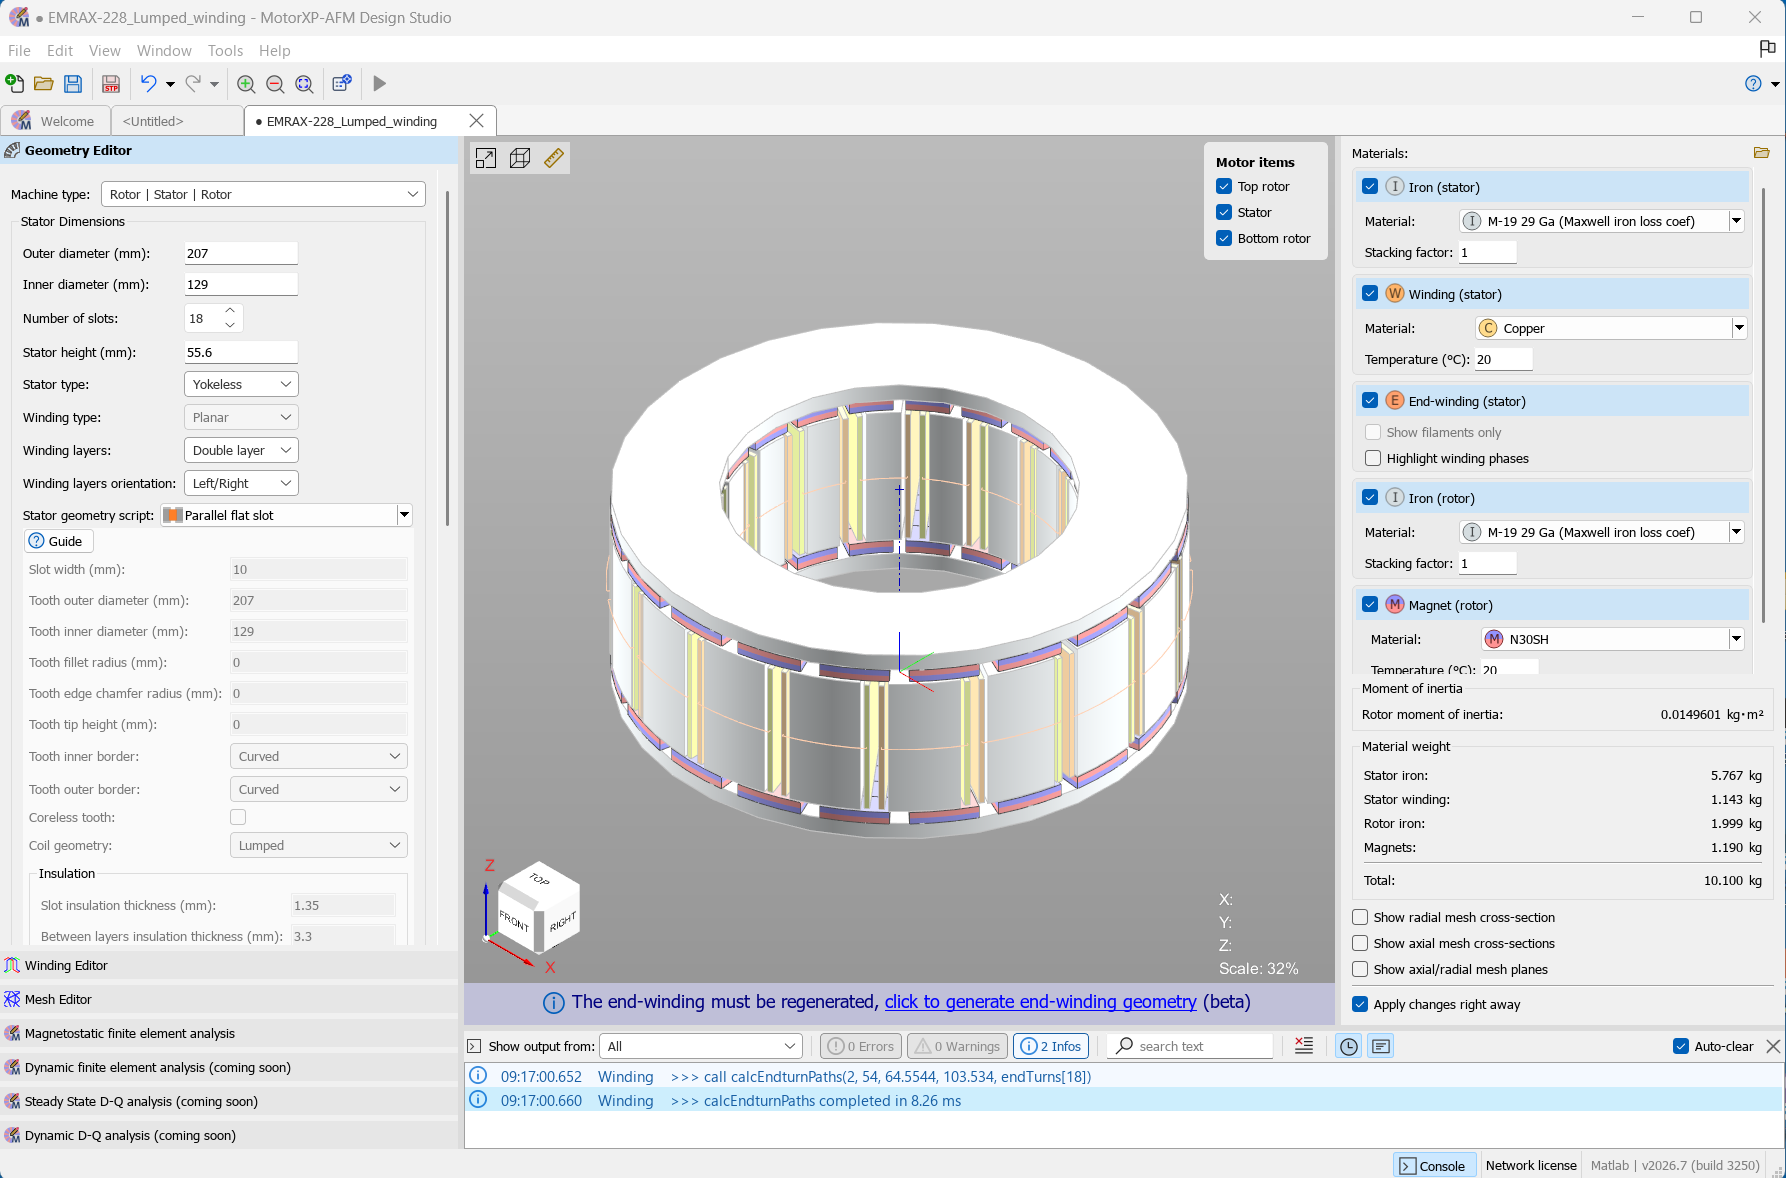
Figure 2. The workspace: workflow panel (left), 3D scene (centre) and context panels (right).
The workflow panel #
The left side of the window is organised as a sequence of workflow stages. Selecting a stage switches both the parameter panel and the contents of the scene. The stages follow the natural design-and-analysis order:
- Geometry Editor — set the machine type (for example, Rotor | Stator | Rotor), the stator and rotor dimensions, the air gap, and the geometry scripts that generate the stator and rotor shapes.
- Winding Editor — define the winding: number of slots and pole pairs, wire size method, number of layers, winding circuit, parallel paths, turns, fill factors and the winding layout, as well as the end-winding geometry.
- Mesh Editor — set up the finite-element mesh: number of axial slices, boundary conditions, element size and quality, and the air-gap mesh. A flat and a 3D view of the mesh are available.
- Magnetostatic finite element analysis — configure the magnetostatic FEA (solver, simulation period, drive settings, rated data) and view the results and plots.
- Dynamic finite element analysis, Steady State D-Q analysis, Dynamic D-Q analysis — additional analysis types (marked coming soon).
The materials of the model — stator and rotor iron, winding, end-winding and magnets — are assigned in the Materials panel, which also reports the material weight and the rotor moment of inertia.
The 3D scene #
The central 3D scene shows the current state of the model and updates as parameters change. Its main navigation aids are:
- an orientation cube (TOP / FRONT / RIGHT / LEFT / BACK / BOTTOM) and a coloured coordinate triad for quickly aligning the view;
- zoom, pan and rotate controls, together with the Zoom fit command to frame the whole model;
- a scale indicator and live cursor coordinates.
Depending on the active stage, the scene displays the motor geometry, the winding layout with the phases highlighted, the finite-element mesh, or the field solution.
Context panels #
The panels on the right change together with the active stage. Typical examples are the Motor items panel, which toggles the visibility of individual parts (top rotor, stator, bottom rotor); the Materials panel; and display options such as Show radial mesh cross-section and Apply changes right away.
Message bar and output console #
A message bar beneath the scene reports the current state of the model and prompts for the next required action — for example, The stator geometry is empty or a link to regenerate the end-winding geometry.
The output console at the bottom of the window collects log messages, grouped into Errors, Warnings and Infos, with a filter and a search field. The console can be shown or hidden with F12 (View > Show console).
Status bar #
The status bar at the very bottom shows the application state (for example, Ready) together with the current error, warning and info counts, the active licensing mode (such as Network license) and, for the MATLAB edition, the MATLAB build in use.
Tip. The workflow panel on the left mirrors the recommended design order — geometry, winding, mesh, analysis. Following it from top to bottom is the quickest way to go from an empty project to a completed simulation.


